
2017 Fair Food Program Report goes behind the numbers to reveal deeper trends in compliance, enforcement…
Tucked away in the 2017 Fair Food Program Report’s voluminous compilation of context, data, and analysis — an overview of which we provided in Tuesday’s post — are a handful of graphs and passages that tell the story behind the raw data. This deeper analysis does something earlier annual reports did not do: It takes a look at the trends in compliance and enforcement over the entire six-season history of the Fair Food Program and pulls out lessons about how actual change on the ground on Fair Food Program farms was achieved over that period. It marks a new level of analysis and transparency in reporting and confirms the importance of the enforcement-focused, market-driven approach at the heart of the Fair Food Program.
This new level of analysis is captured in two key measures: results (the ebb and flow of compliance on participating farms over time) and complaints (the changing nature of, and cooperation in resolving, complaints over time). We will begin with results.
i. Results…
The section that makes up the bulk of the annual report, entitled “Results,” begins with several paragraphs of introduction. Here is an excerpt:
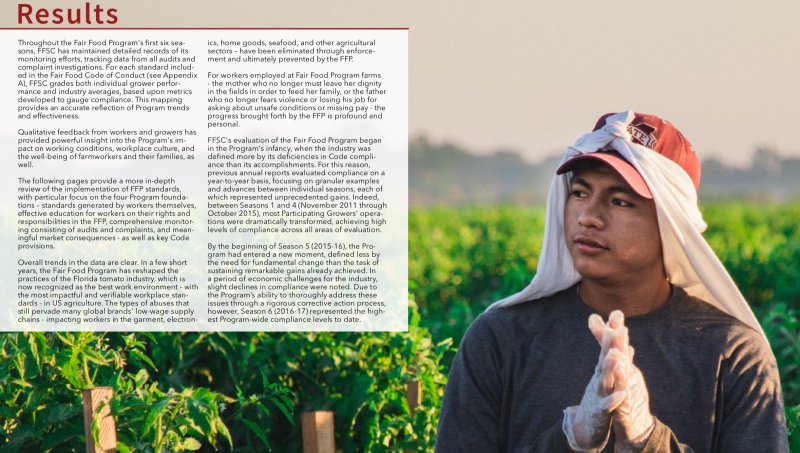
Throughout the Fair Food Program’s first six seasons, FFSC has maintained detailed records of its monitoring efforts, tracking data from all audits and complaint investigations. For each standard included in the Fair Food Code of Conduct (see Appendix A), FFSC grades both individual grower performance and industry averages, based upon metrics developed to gauge compliance. This mapping provides an accurate reflection of Program trends and effectiveness…
… FFSC’s evaluation of the Fair Food Program began in the Program’s infancy, when the industry was defined more by its deficiencies in Code compliance than its accomplishments. For this reason, previous annual reports evaluated compliance on a year-to-year basis, focusing on granular examples and advances between individual seasons, each of which represented unprecedented gains. Indeed, between Seasons 1 and 4 (November 2011 through October 2015), most Participating Growers’ operations were dramatically transformed, achieving high levels of compliance across all areas of evaluation.
By the beginning of Season 5 (2015-16), the Program had entered a new moment, defined less by the need for fundamental change than the task of sustaining remarkable gains already achieved. In a period of economic challenges for the industry, slight declines in compliance were noted. Due to the Program’s ability to thoroughly address these issues through a rigorous corrective action process, however, Season 6 (2016-17) represented the highest Program-wide compliance level to date.
The report then translates those paragraphs into a single graph, charting the progress of average compliance scores across Seasons One-Six. Its slope (the rate and direction of change over time), tells a story of a rapid and strong advance during the early years of the Program (Seasons One-Four), followed by a season of retrenchment (Season Five), and followed again by a new season of advance, as the Program’s corrective action mechanisms resulted in a significant rebound (Season Six):
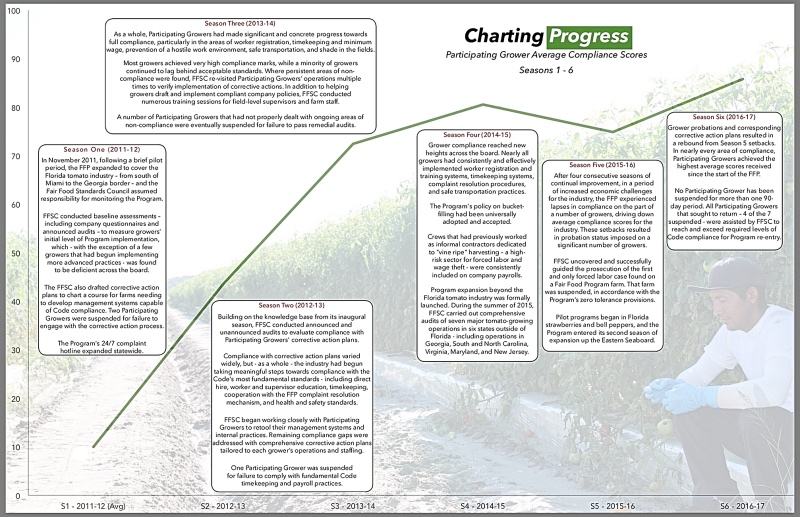
While the arc of the curve, and the shifts in that arc over the Program’s six seasons, are the main story here, the text boxes summarizing compliance per season are important as well. As the text is too small to read in the format of the photo above, we are including each text box in its entirety here below, in order:
Season One (2011-12)
In November 2011, following a brief pilot period, the FFP expanded to cover the Florida tomato industry – from south of Miami to the Georgia border – and the Fair Food Standards Council assumed responsibility for monitoring the Program.
FFSC conducted baseline assessments – including company questionnaires and announced audits – to measure growers’ initial level of Program implementation, which — with the exception of a few growers that had begun implementing more advanced practices — was found to be deficient across the board.
The FFSC also drafted corrective action plans to chart a course for farms needing to develop management systems capable of Code compliance. Two Participating Growers were suspended for failure to engage with the corrective action process.
The Program’s 24/7 complaint hotline expanded statewide.
***************************
Season Two (2012-13)
Building on the knowledge base from its inaugural season, FFSC conducted announced and unannounced audits to evaluate compliance with Participating Growers’ corrective action plans.
Compliance with corrective action plans varied widely, but — as a whole — the industry had begun taking meaningful steps towards compliance with the Code’s most fundamental standards — including direct hire, worker and supervisor education, timekeeping, cooperation with the FFP complaint resolution mechanism, and health and safety standards.
FFSC began working closely with Participating Growers to retool their management systems and internal practices. Remaining compliance gaps were addressed with comprehensive corrective action plans tailored to each grower’s operations and staffing.
One Participating Grower was suspended for failure to comply with fundamental Code timekeeping and payroll practices.
***************************
Season Three (2013-14)
As a whole, Participating Growers had made significant and concrete progress towards full compliance, particularly in the areas of worker registration, timekeeping and minimum wage, prevention of a hostile work environment, safe transportation, and shade in the fields.
Most growers achieved very high compliance marks, while a minority of growers continued to lag behind acceptable standards. Where persistent areas of non-compliance were found, FFSC re-visited Participating Growers’ operations multiple times to verify implementation of corrective actions. In addition to helping growers draft and implement compliant company policies, FFSC conducted numerous training sessions for field-level supervisors and farm staff.
A number of Participating Growers that had not properly dealt with ongoing areas of non-compliance were eventually suspended for failure to pass remedial audits.
***************************
Season Four (2014-15)
Grower compliance reached new heights across the board. Nearly all growers had consistently and effectively implemented worker registration and training systems, timekeeping systems, complaint resolution procedures, and safe transportation practices.
The Program’s policy on bucket-filling had been universally adopted and accepted.
Crews that had previously worked as informal contractors dedicated to “vine ripe” harvesting – a high-risk sector for forced labor and wage theft — were consistently included on company payrolls.
Program expansion beyond the Florida tomato industry was formally launched. During the summer of 2015, FFSC carried out comprehensive audits of seven major tomato-growing operations in six states outside of Florida — including operations in Georgia, South and North Carolina, Virginia, Maryland, and New Jersey.
***************************
Season Five (2015-16)
After four consecutive seasons of continual improvement, in a period of increased economic challenges for the industry, the FFP experienced lapses in compliance on the part of a number of growers, driving down average compliance scores for the industry. These setbacks resulted in probation status imposed on a significant number of growers.
FFSC uncovered and successfully guided the prosecution of the first and only forced labor case found on a Fair Food Program farm. That farm was suspended, in accordance with the Program’s zero tolerance provisions.
Pilot programs began in Florida strawberries and bell peppers, and the Program entered its second season of expansion up the Eastern Seaboard.
***************************
Season Six (2016-17)
Grower probations and corresponding corrective action plans resulted in a rebound from Season 5 setbacks. In nearly every area of compliance, Participating Growers achieved the highest average scores received since the start of the FFP.
No Participating Grower has been suspended for more than one 90-day period. All Participating Growers that sought to return – 4 of the 7 suspended — were assisted by FFSC to reach and exceed required levels of Code compliance for Program re-entry.
The story captured in this meta-analysis of the individual compliance data from participating farms — transformed into average compliance across all participating farms per season — tells of the back and forth of inspection and correction that defines a program of genuine social responsibility. Inspection, through audits and, most importantly, through a continual complaint investigation and resolution process, reveals non-compliance, prompting a corrective action plan and further inspection to determine compliance with the plan. Real social responsibility occurs in the changes wrought by the process. Likewise, the charting across the period of the rises — and the dips — in compliance brought about by this process is also the hallmark of the honesty and transparency of real social responsibility.
[By way of comparison, here’s what Wendy’s Chief Communications Officer Liliana Esposito had to say to shareholders at last year’s annual meeting about progress under the company’s Supplier Code of Conduct: Wendy’s had “once again achieved 100% affirmation” from all suppliers that are covered by the code that they are “aware of and adhering to the obligations that we have put forward for them.” The claim of 100% adherence is absurd on its face for any social responsibility program, much less when that claim is made on the basis of self-reporting from suppliers on their own levels of compliance.]
ii. Complaints
The second section of the report in which this new analysis over the full six seasons of the Fair Food Program’s operation is applied is in the area of complaints. Take a look at these two graphs, found on page 39 of the report:
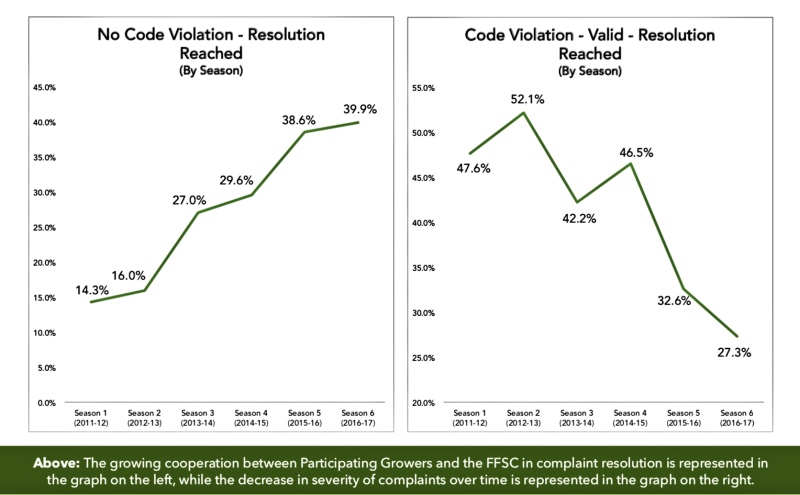
As was the case with compliance, these two graphs reveal clear and compelling trends in the nature of complaints, as well as the level of collaboration between Participating Growers and the Program in resolving complaints, over time.
In the first figure (on the left), the graph tracks the steadily increasing percentage of overall complaints resolved per season that do not involve a violation of the Code, but are reported by workers through the complaint line. This category includes everything from streamlining final check-forwarding procedures to agreeing to implement the Program’s innovative sexual harassment curriculum before any particular violations are found. A substantial number of the resolutions reached in this category are cases in which Code violations are alleged, but are not able to be confirmed through investigation. Nevertheless, because they have come to truly value the Program’s risk prevention mechanisms, many growers opt to take some action to either correct or prevent violations, as the case may be, and to increase their own oversight in the area flagged by the complaint notification.
This measure is an excellent proxy for the degree of cooperation on the part of Participating Growers in resolving workers’ complaints, as these are issues which growers are under no obligation to resolve. Fittingly, during the first, most conflictual years of the program, the percentage of such complaints resolved barely broke 10%; by Season Six, however, nearly 4 out of every 10 complaints resolved involved issues beyond the scope of the Fair Food Code of Conduct. This reflects the growing willingness of employers to address issues that improve workers’ lives even when they are not compelled to do so by their participation in the Program. It is a measure not only of trust in the complaint process, but also of belief in the proposition that better working conditions are a benefit to both the employee and the employer, alike.
The second figure (on the right), tracks the steadily declining percentage of resolved complaints that involve violations of the Fair Food Code of Conduct. While this is to some degree the flip side of the first graph, the decline is not entirely attributable to the increase in non-Code related complaints. As there are other categories in the overall data around complaint resolution (e.g., No Code Violation/Not Valid after Investigation, Informational Only, etc.), the rise in the first graph is not necessarily directly correlated with a matching decline in the second.
Rather, the second also indicates a generally declining trend in the severity of complaints received by the Fair Food Standards Council over the six years of the Program’s operation. While effectively half of all complaints resolved involved Code violations in the early years of the program, by Season Six that number had fallen nearly by half, to just over 25%.
Taken together, these two graphs that emerge from the next level analysis of complaint data over time paint the picture of a workplace in the Fair Food Program that is not only growing more humane by the season, but within which workers and their employers are finding more and more common ground on which they can collaborate to improve both conditions for workers and the business of agriculture for growers.
What makes it all work? Market-Based Enforcement
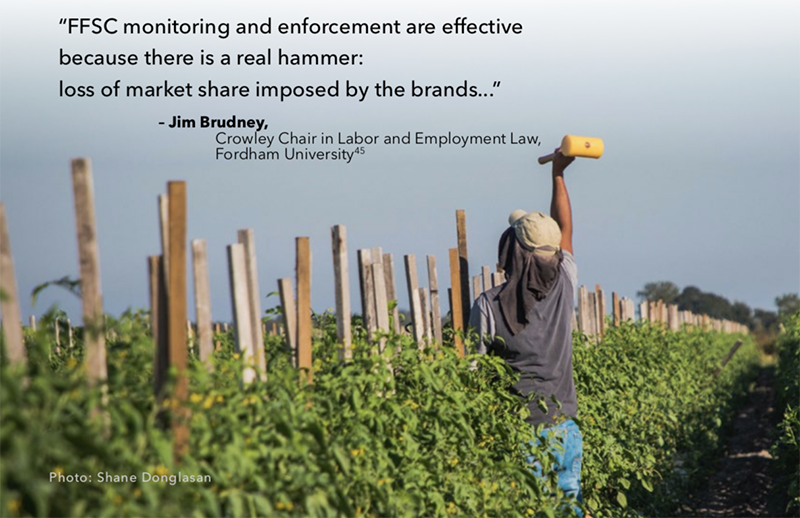
In closing, it is worth remembering what makes the Fair Food Program work. It is not, alone, the excellent and tireless work of the Fair Food Standards Council auditors, though their work is indeed exceptional and contributes significantly to the Program’s unique success. And it is not, in isolation, the many elements — from worker-to-worker education to the 24-hour complaint line and deep-dive audits — that make up the Program’s multi-faceted approach to monitoring.
Rather, in the final analysis, behind all of this progress on the ground is the Fair Food Program’s credible threat of market consequences for failure to fix incidences of non-compliance as they arise. As the authors of the report write, when referring to the dip in compliance during Season Five noted in the section on results: “Due to the Program’s ability to thoroughly address these issues through a rigorous corrective action process, however, Season 6 (2016-17) represented the highest Program-wide compliance level to date.” The rigor to which the authors refer is not only that of the process itself, but of the real, and demonstrated, prospect of loss of sales to Participating Buyers that growers must take into consideration when responding to the FFP corrective action process. That prospect is effectively absent in the vast majority of social responsibility programs active today, in agriculture or other corporate supply chains.
In a separate section, the report concludes:
The FFP is an enforcement-focused approach to social accountability, and enforcement needs teeth to work. Market consequences – built into the Program through CIW’s Fair Food Agreements with Participating Buyers – are the teeth of the Fair Food Program…
… Initial failure to address violations through agreed-upon corrective actions may result in probationary status, while continued failure to address Code violations results in suspension from the Program. If Participating Growers do not come into compliance with the Code through agreed upon corrective actions, they simply cannot sell to Participating Buyers.
In the end, real teeth — like the market consequences in the Fair Food Program — are what separate meaningful social responsibility programs, and the measurable change they bring about in workers’ lives, from the drivel of standards without enforcement, which constitutes the defining character of the traditional practice of corporate social responsibility.
Check out the 2017 report in full here.
And check back soon for much more from the continuing battle to bring Wendy’s into the Fair Food Program fold.